CONNECTING HIGH-INTENT CONSUMERS WITH TOP BRANDS


We simplify decision-making and shopping journeys by connecting consumers with industry-leading brands.
Our consumer decision journeys enable brands and publishers to enjoy significant revenue growth.
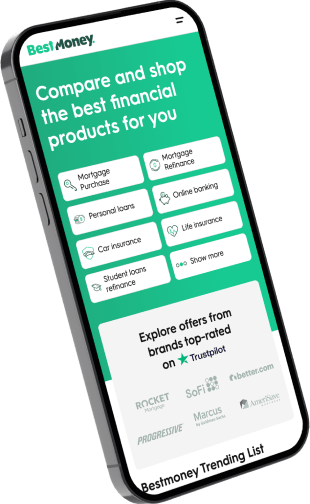
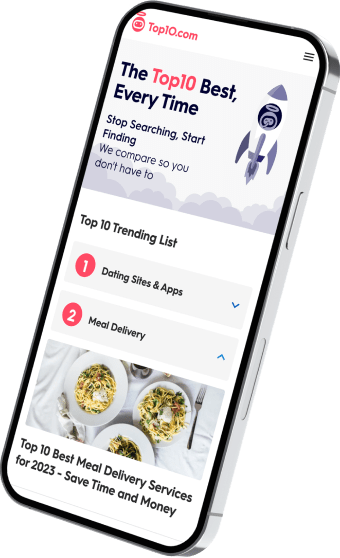
Be there when they compare
reach consumers with high purchase intent
Monetize your High-Intent audience
IT'S Not Magic, IT'S TECHNOLOGY
By utilizing millions of end-to-end user interactions across dozens of categories, our proprietary technology platform, xMatch, maximizes marketing, monetization, and user experience efficiency.
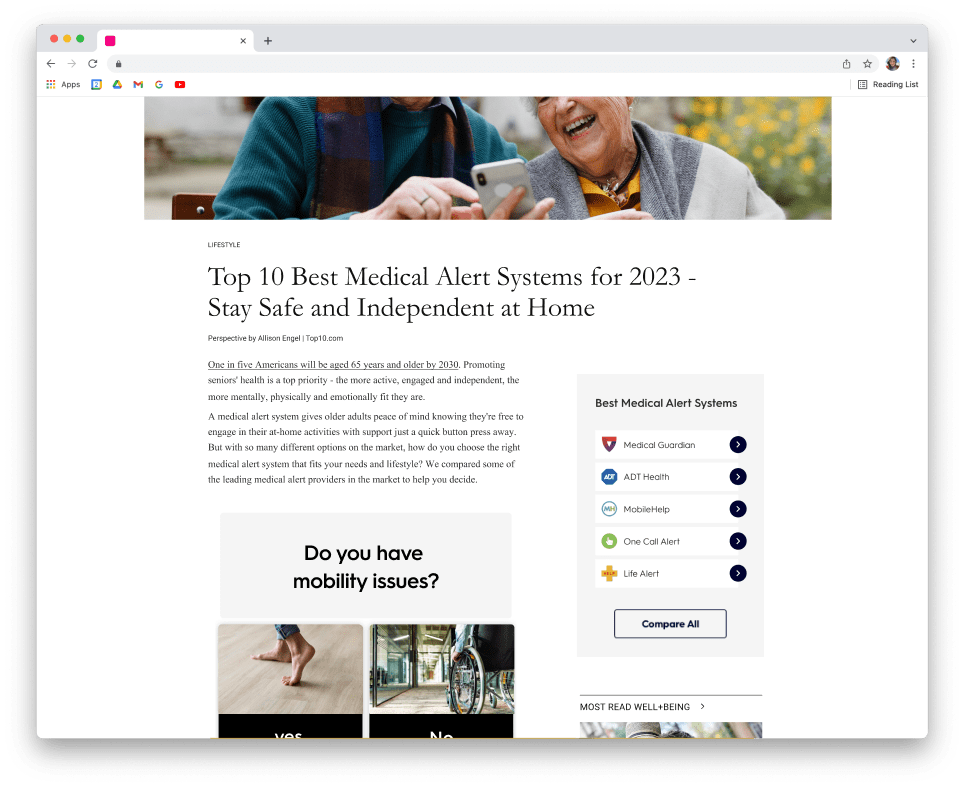
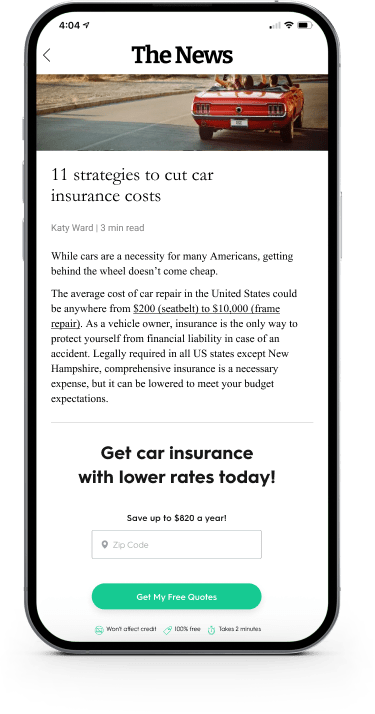
Our technology touches the consumer in every step of the journey, from the ads they watch to the decision-making user experiences all the way to purchasing on brands’ websites.
WHAT'S IT LIKE TO WORK WITH US?
We are privileged to work with incredible companies, here are a few: